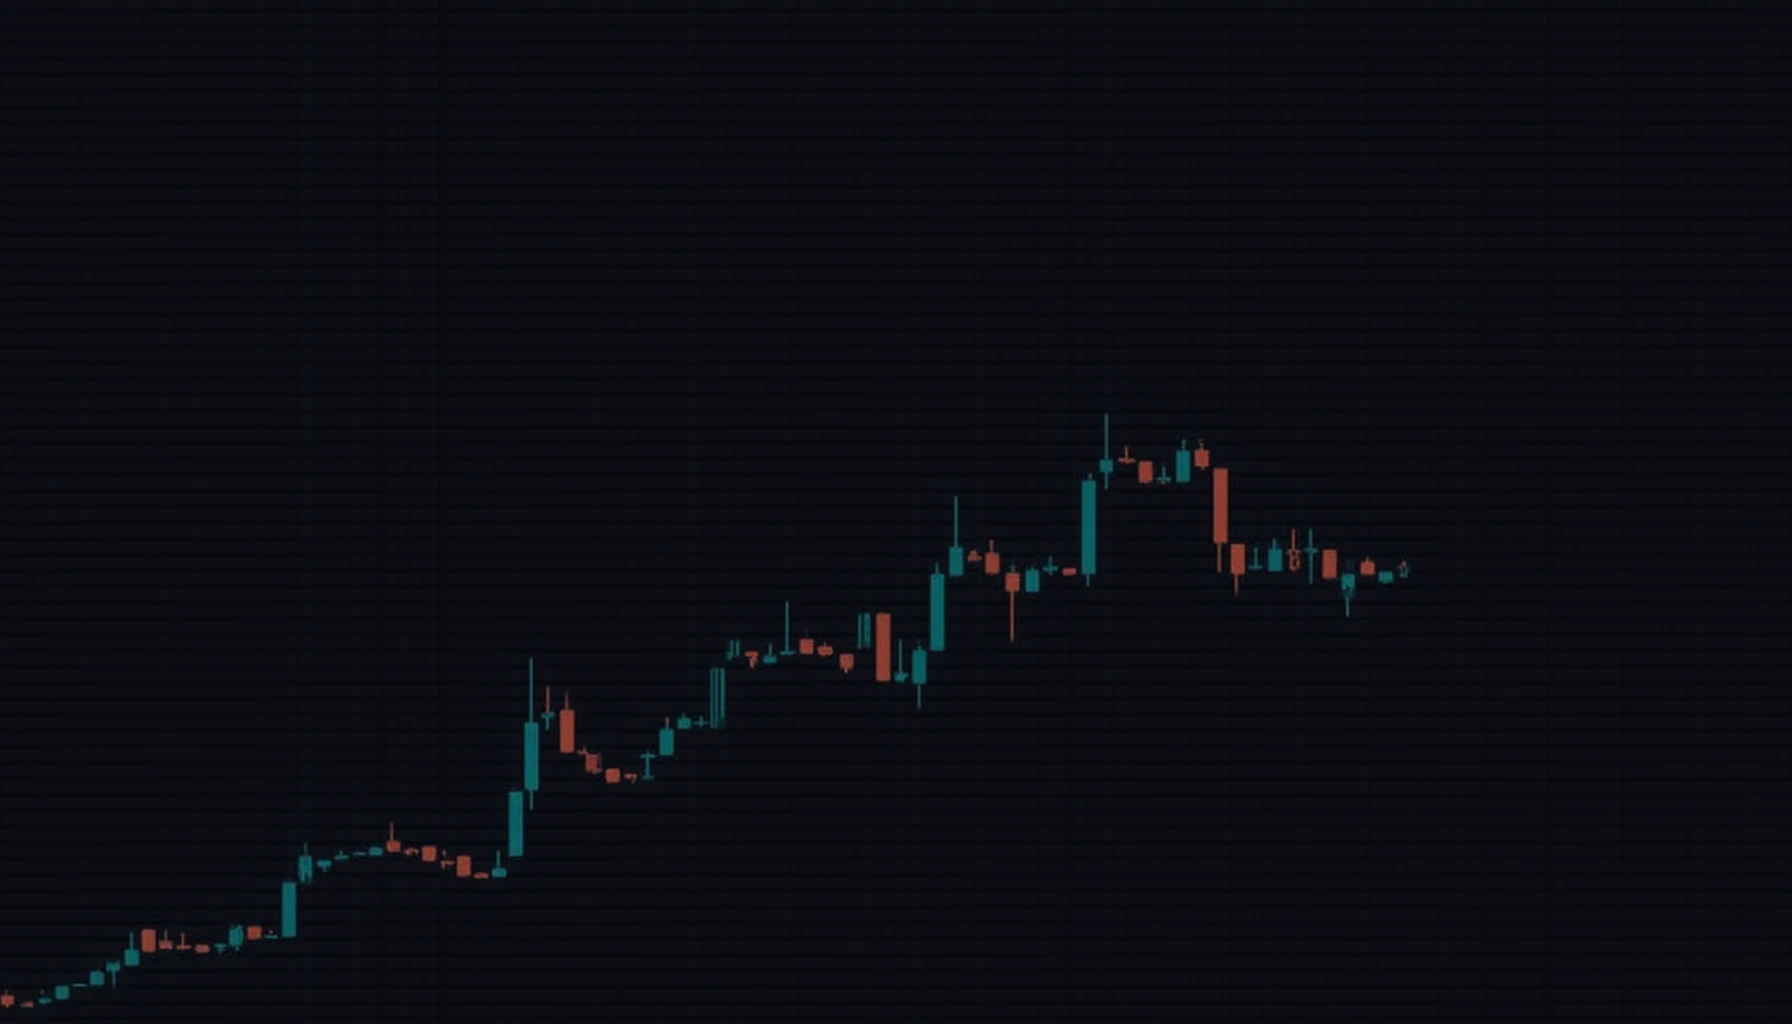
Introduction: Understanding Bitcoin Price Charts
With over 5.6 million Bitcoin holders around the globe, only a fraction truly understand how to read Bitcoin price charts effectively. Are you part of that group looking to gain insights into your investments? In this guide, we’ll walk you through the essentials of understanding Bitcoin price charts.
What are Bitcoin Price Charts?
Bitcoin price charts provide a graphical representation of the currency’s performance over time. These charts can help you make informed trading decisions based on historical data and trends. There are various types of charts, but the most common include:
- Line charts: Simple visualizations showing price movements over time.
- Bar charts: Offer more data with open, high, low, and close prices.
- Candlestick charts: Show price movement trends, providing a better outlook on market sentiment.
Reading Price Movements: Key Indicators
Understanding key indicators in price charts will help you anticipate future movements. Here are a few important aspects to consider:

- Support and Resistance Levels: Support is the price level at which Bitcoin tends to stop falling, while resistance is where it usually stops rising.
- Moving Averages: These smooth out price data by creating a constantly updated average price, helping you identify trends more clearly.
- Trading Volume: The number of Bitcoins traded within a specific timeframe is crucial for understanding market demand.
Applying Technical Analysis: Tools for Beginners
As a beginner, you might feel overwhelmed by technical analysis, but breaking it down helps. Here’s how to apply it:
- Identify Patterns: Look for price patterns like head and shoulders or triangles, which can indicate potential future movements.
- Use Indicators: Incorporate tools like the Relative Strength Index (RSI) or the Moving Average Convergence Divergence (MACD) for gauging market conditions.
- Backtesting: Test your strategies using past data to see how effective they may be in the current or future market.
Practical Tips for Reading Bitcoin Price Charts
Reading charts isn’t just about numbers; it’s understanding market psychology. Here are practical tips:
- Stay Updated: Always track industry news, as events can influence price movements significantly.
- Create a Watchlist: Focus on a few cryptocurrencies to analyze regularly instead of spreading your attention too thin.
- Practice Regularly: The more you practice reading charts, the better you will become. Use demo accounts to hone your skills.
Conclusion: Start Analyzing Bitcoin Today!
Understanding how to read Bitcoin price charts is essential for navigating the volatile world of cryptocurrency trading. Implement these strategies, stay informed, and practice regularly to enhance your trading prowess. Ready to dive into the market? Start your analysis today!
For more cryptocurrency insights, visit Hibt.com and explore our latest articles.
Note: This article does not constitute investment advice. Please consult with local regulatory authorities before making any trading decisions.


