Introduction
Have you ever wondered why Bitcoin’s price can skyrocket one day and plummet the next? With over 5.6 million Bitcoin holders globally, understanding market trends is crucial. This article delves into the basics of technical analysis to help you decode Bitcoin market movements effectively.
Understanding Technical Analysis
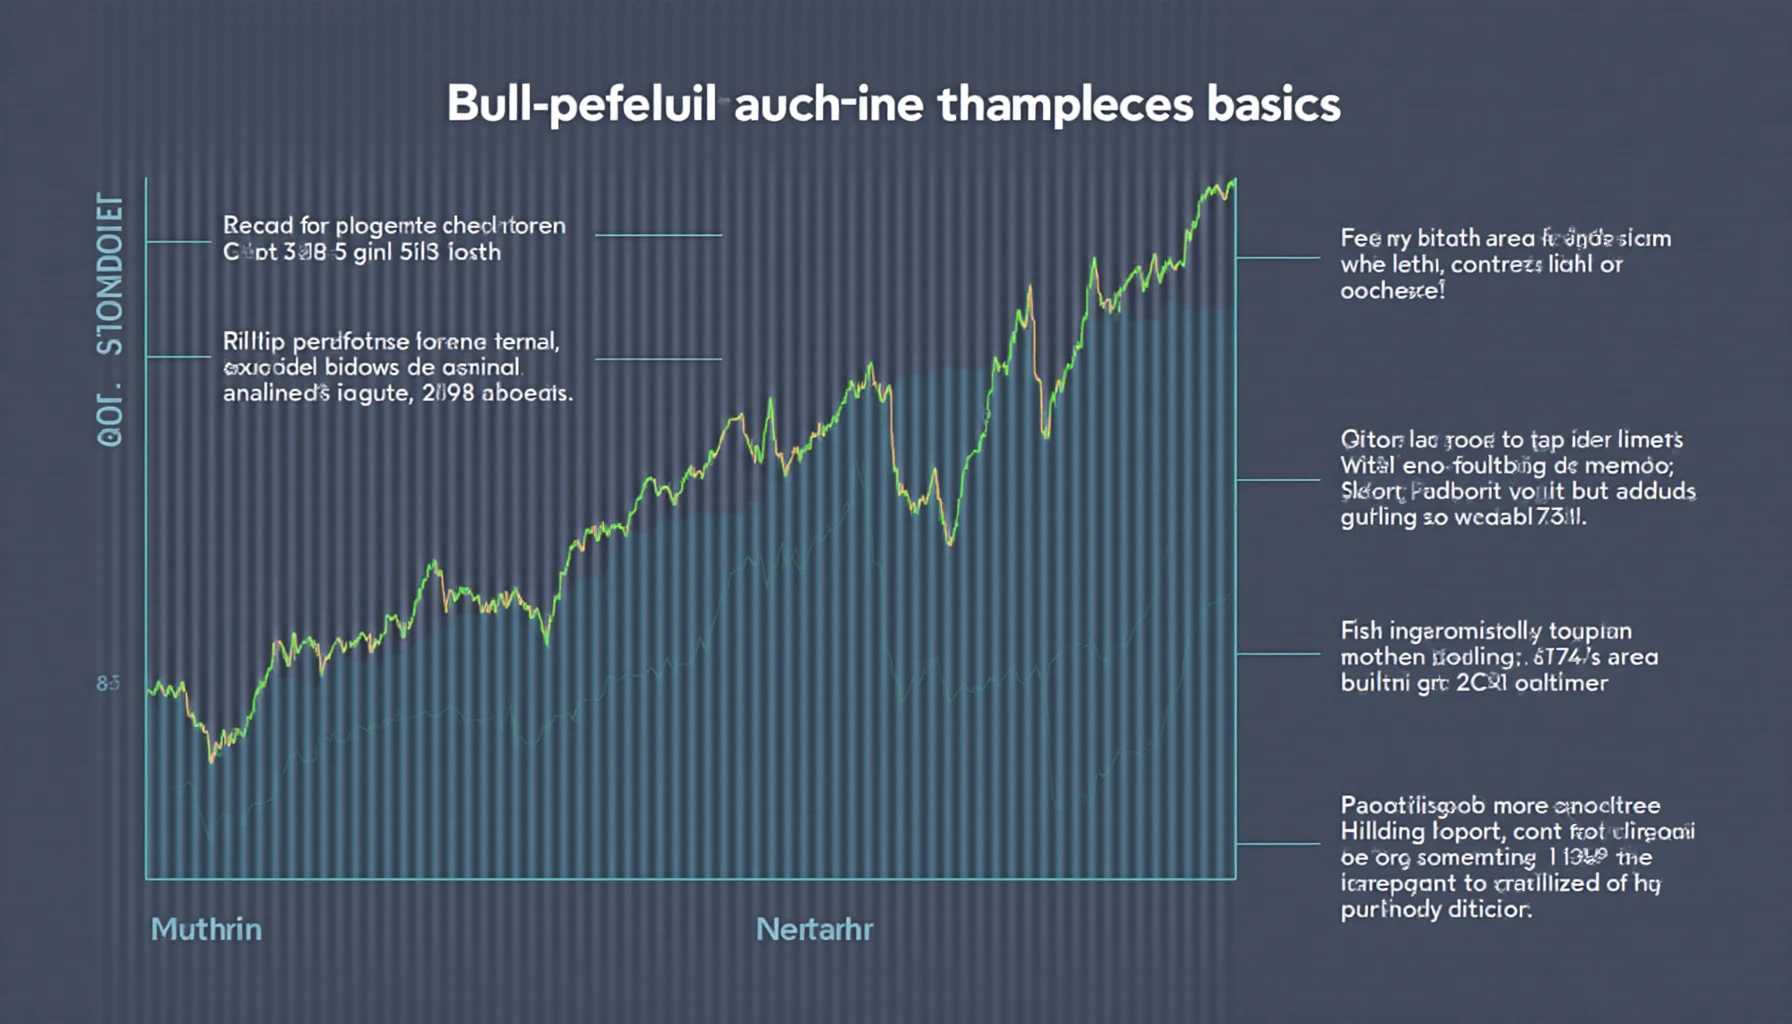
Technical analysis involves studying price data and trading volumes to forecast future price movements. Think of it like looking at weather patterns to predict tomorrow’s climate. By analyzing historical trends, you can identify potential future movements in the Bitcoin market.
Key Terminology
- Support and Resistance: Support is the price level where buying interest prevents further declines, while resistance is where selling interest halts price increases.
- Trends: A trend is the general direction in which Bitcoin prices are moving. Recognizing an upward or downward trend can provide valuable insights.
- Indicators: Tools like the Moving Average or Relative Strength Index help traders make informed decisions based on price patterns.
Conducting Market Analysis
Here’s how you can start analyzing Bitcoin market trends:

- Event Tracking: Major events (like regulations or technological advancements) can impact Bitcoin prices. Always stay updated with current news.
- Chart Patterns: Familiarize yourself with chart patterns such as flags, head-and-shoulders, and triangles. They often indicate reversal or continuation signals.
- Volume Analysis: Analyzing trade volumes alongside price movements can confirm trends. For example, increasing volume during a price rise signals strong buying interest.
Using Indicators for Better Insights
Indicators make it easier to interpret market conditions. Here are two popular indicators:
- Moving Averages: They smooth price data and help identify trends. For instance, a cross of the 50-day moving average above the 200-day moving average could signal a bullish trend.
- Relative Strength Index (RSI): RSI indicates whether Bitcoin is overbought or oversold. An RSI above 70 suggests overbought conditions, while below 30 indicates oversold conditions.
Practical Tips for New Traders
As a fresh trader, you may find the Bitcoin market overwhelming. Here are some tips:
- Start Small: Begin with a small investment to reduce risk. Think of it like planting a seed before growing a garden.
- Stay Informed: Follow reputable sources for market updates and analysis. Websites like hibt.com can provide valuable insights.
- Utilize Tools: Consider using software like TradingView to enhance your analysis and replicate investment strategies.
Conclusion
In summary, analyzing Bitcoin market trends requires a solid understanding of technical analysis concepts. By applying support and resistance levels, recognizing chart patterns, and using key indicators, you can improve your trading decisions. Don’t forget to stay updated with market news and start small to minimize risk.
Ready to take your Bitcoin analysis skills to the next level? Download our Bitcoin Analysis Guide today!


